Home › Forums › HAast (High Availability for Asterisk) › Configuration & Optimization › What are sensors, and why does the GUI show “0” all the time
-
AuthorPosts
-
I have HAAst working great, and is seems to detect every problem I throw at it. The only thing I can’t figure out is the ‘sensors’ graph in the GUI. What’s it for, and how do I make sensors appear on this graph? (It’s stuck at 0)
HAAst includes approximately 18 “internal sensors” which are used to determine if the PBX and it’s environment are within normal parameters, and allow the PBX to properly offer telephony services. These sensors are used to assess whether or not the node can keep operating or must demote and let the peer take over. This is a binary decision (yes/no) determined by HAAst. This assessment and determination are made behind the scenes, and have nothing to do with the sensors graph in the GUI.
Aside from the internal sensors, HAAst also has the ability to monitor optional “external sensors”. These sensor are defined by you (the administrator) and can sense just about anything. For example, clients have used external sensors to measure:
- Performance of a network path: Counting pings lost from source IP to destination IP. This can be used to measure route quality, or even something as simple as sense an unplugged network cable.
- Calls in progress: Some large call centers never have less than X calls per second coming in from their carrier. If this drops to 0 it might mean an upstream carrier issue, 800 number failure, etc.
- Data center environmental temperature: If the data center room temperature exceeds X degrees HAAst can initiate a fail over.
- Custom: Anything from a contact closure (big red fail over button), to a local CRM systems being down, to power supply voltages out of range, etc.
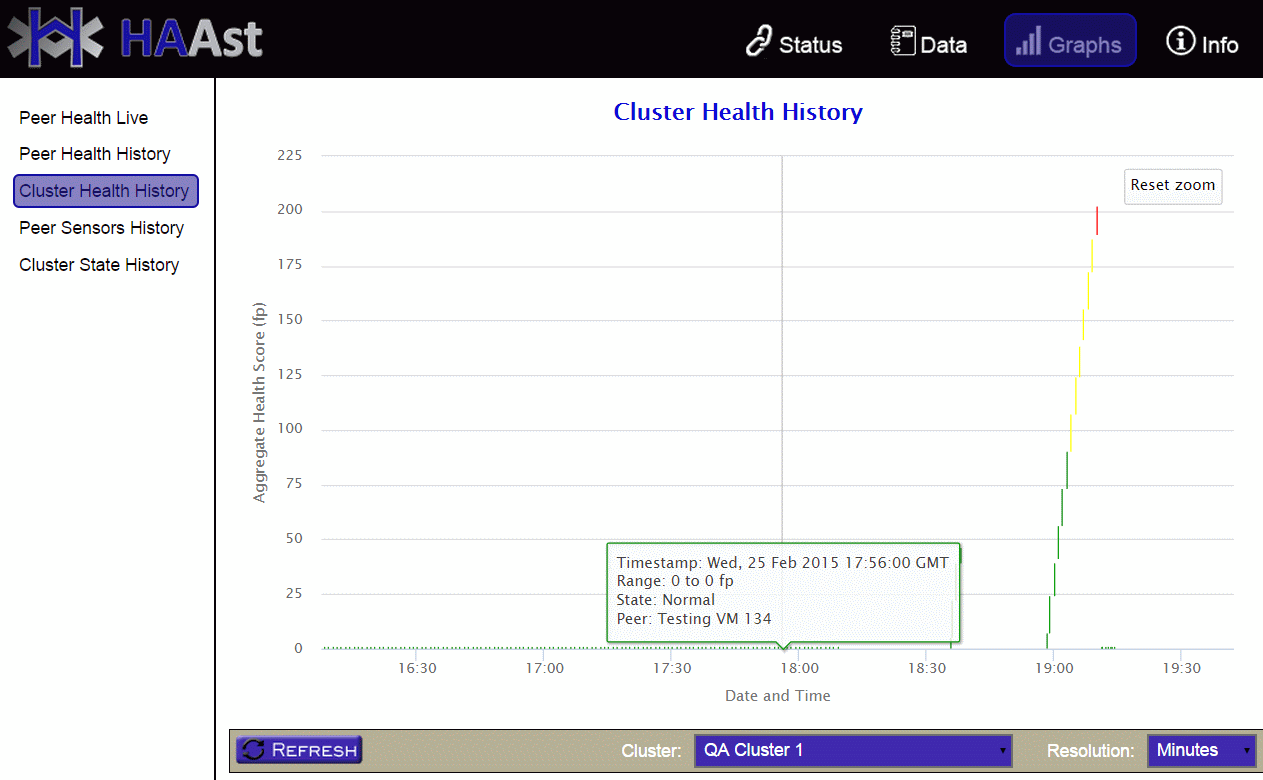
Each of the above sensors turns an input value (number/string/etc) into a numeric value, which adds to the health score. That health score is what you see on the GUI’s sensors graph as show below. If the score reaches a danger threshold set by you (the administrator), HAAst can automatically run scripts or take some other action. And if that score reaches the fail over threshold, then HAAst will transfer control to the peer.
You can define as many or as few sensors as your like, and weight their scores as you like, to create a health scoring system meaningful to your environment. Similarly, you can set the critical and fail over thresholds to suit your needs.
Telium would be pleased to assist you in designing and setting up sensors. As well, we would be happy to create custom sensors to gather input from any device/service you wish (as a professional services project). We have interfaced with serial devices, thermostats, 1-wire networks, Bluetooth devices, and more.
Please remember that external sensors are completely optional and need to be tailored to your unique environment. Many clients run without any additional (external) sensors.
-
This reply was modified 5 years, 5 months ago by
WebMaster.
For example, if you copy the text below and place it into the file /etc/xdg/telium/haast.conf.d/network_cable.sensors.conf then you can test the sensors graph on the GUI. This sensors checks if the network connection on ‘eth1’ is down. If the connection is down the health score increases by 5 points. If the connection is up the health score remains unchanged for that cycle. (i.e. 0 health points).
If HAAst can’t read the NIC, then an error score of 20 is used. If HAAst can talk to the NIC but not extract a state then the warning score of 10 is used. If the sensors reports 0, then the cumulative score for this sensors is reset to 0. This sensor runs every 5 seconds.
So restart HAAst with this sensor in place and open up the graph on the HAAst GUI. Unlpug the network cable and watch your score, then replug the cable and see it reset to 0. If you leave the cable unplugged long enough and the health score reaches the critical level, then your cluster will fail-over to the peer.
; Test to ensure a network cable is plugged into the NIC, and that the cable is live (i.e. other end is plugged in)

network-cable/description=Cable plugged in

network-cable/type=nic

network-cable/input=state

network-cable/parameters=state:ethernet | interface:eth1

network-cable/scoring= =up:0 | :5

network-cable/warningscore=10

network-cable/errorscore=20

network-cable/resetcumulativescore=0

network-cable/interval=5

network-cable/debug=false
-
This reply was modified 5 years, 5 months ago by
-
AuthorPosts
- You must be logged in to reply to this topic.